
Antarctic Data Sources
This page provides details of all data sources contributing to our Antarctic data cube.
3.1. Data Source Overview
Our Antarctic ice speed data cube is created from seventeen individual data sources:
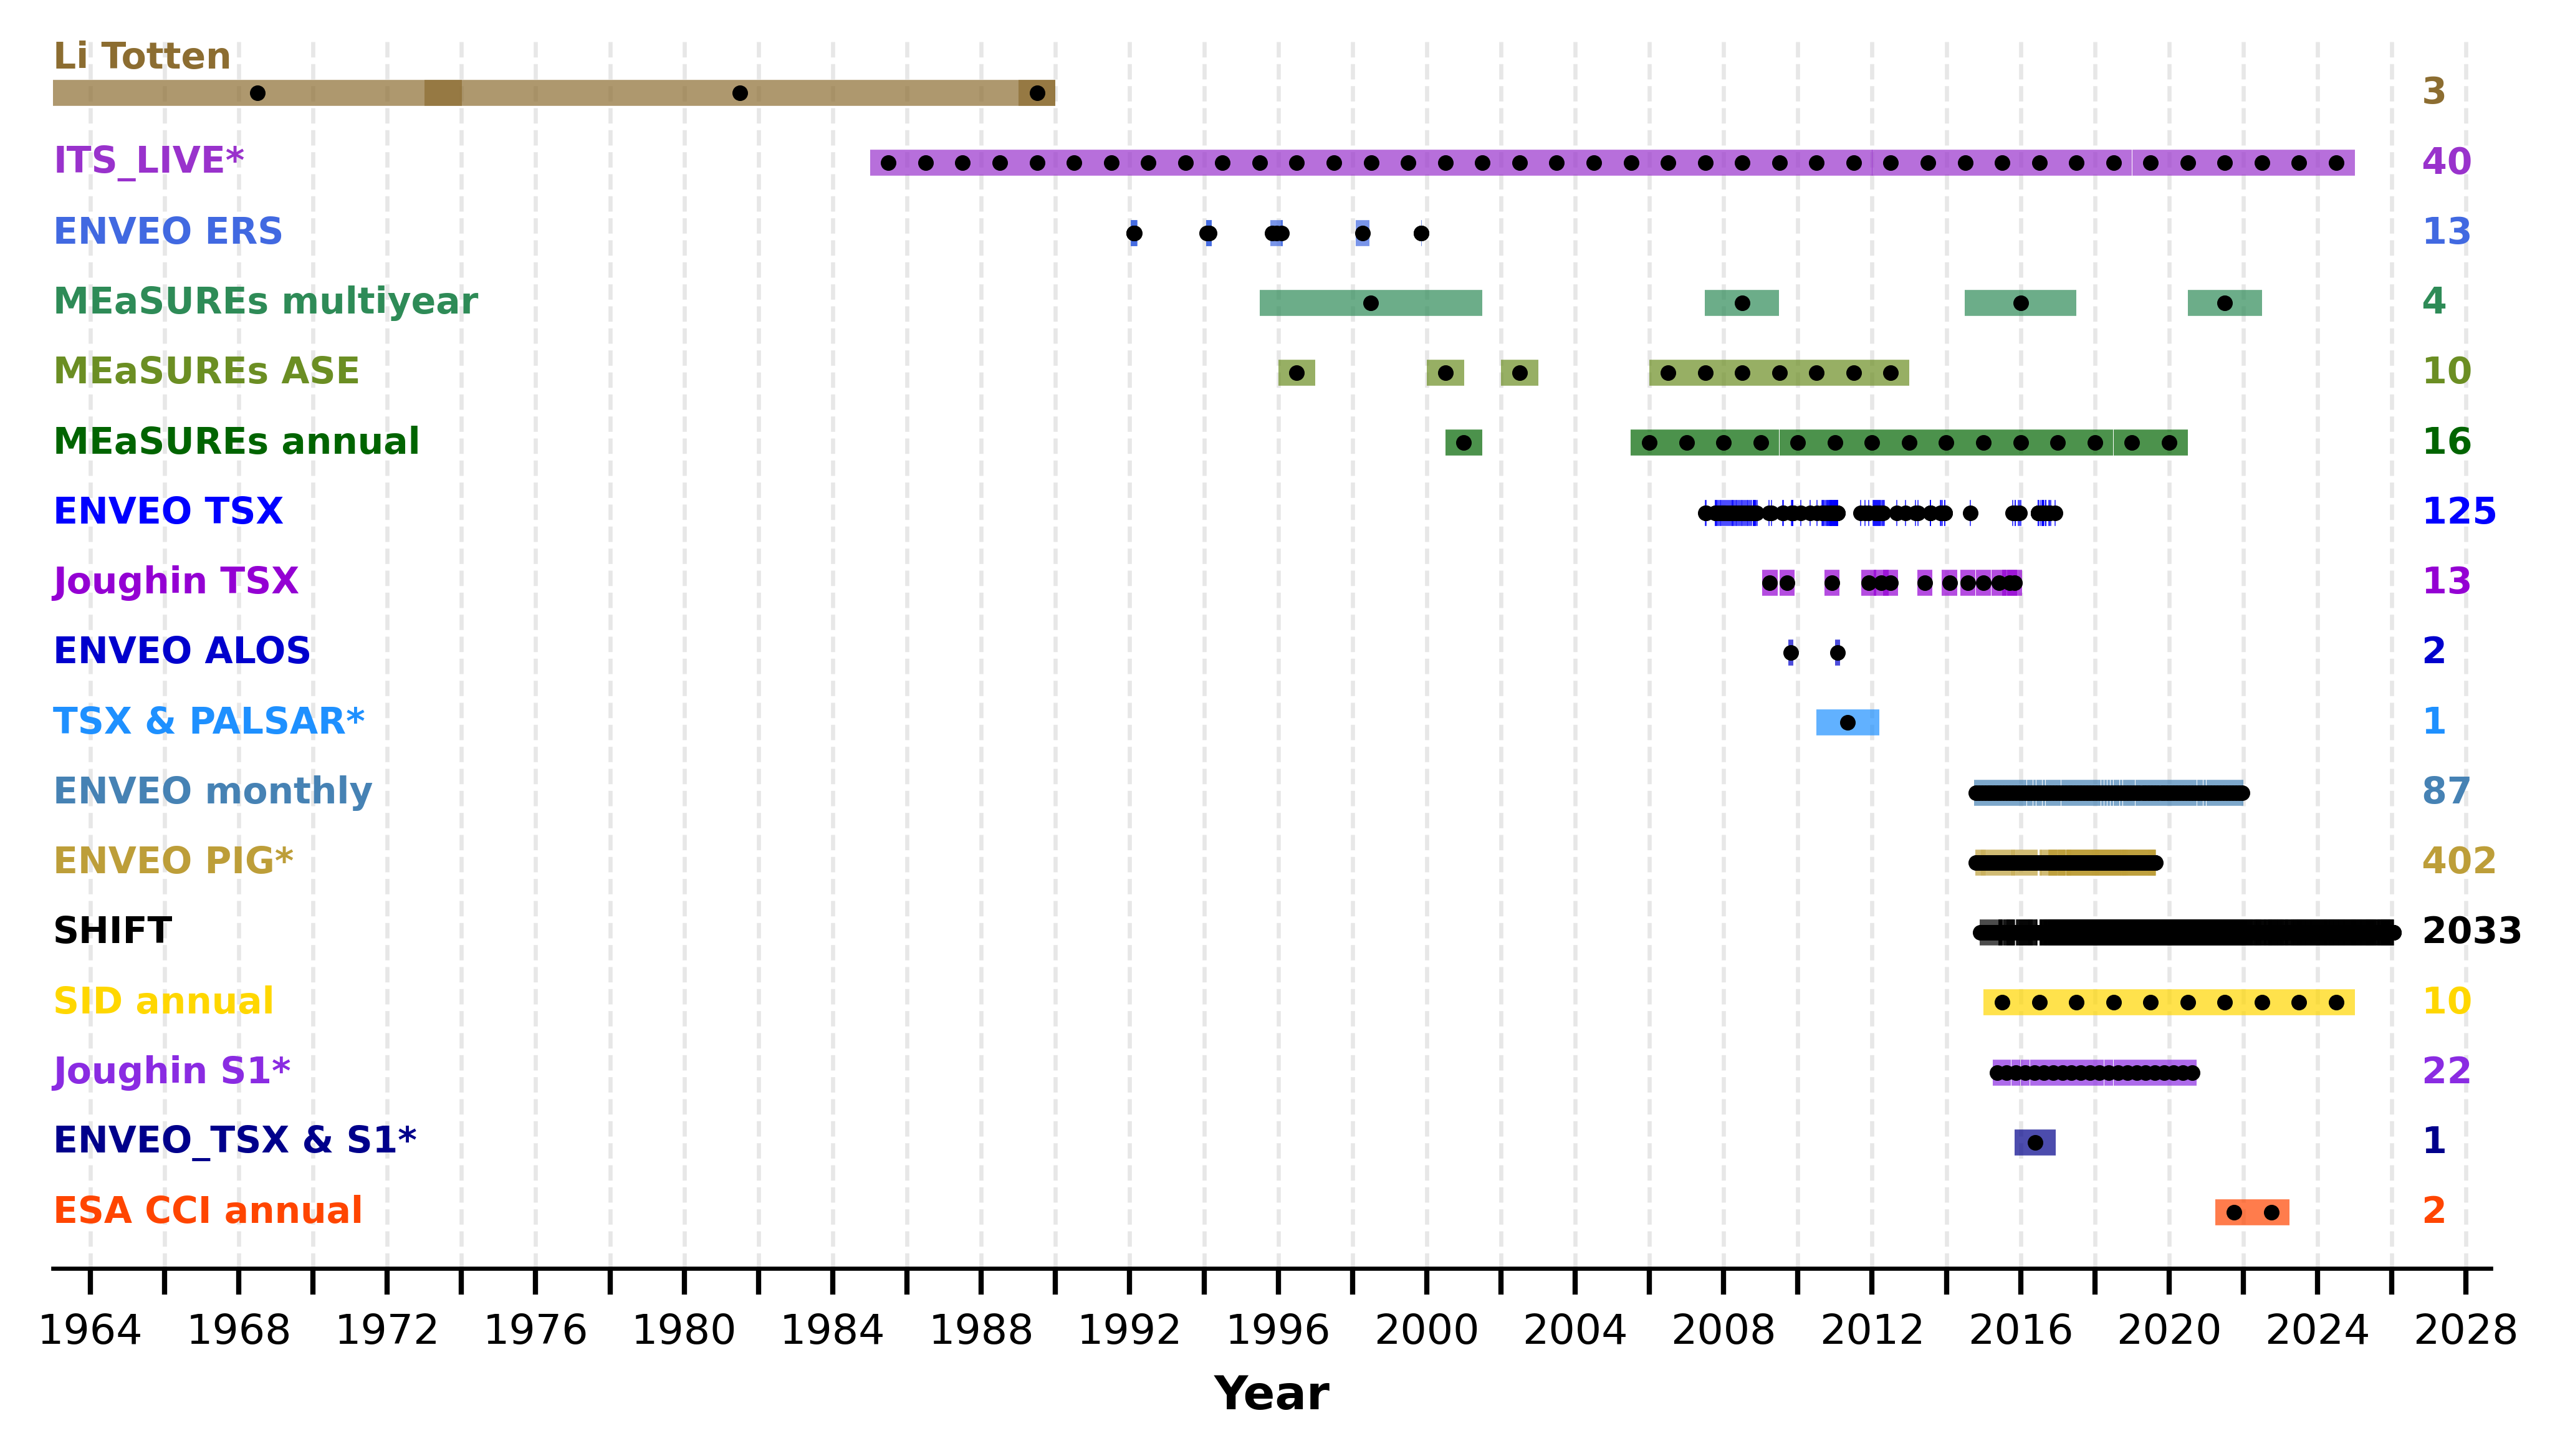
- SHIFT: 12-day snapshots over the Antarctic Peninsula. 2014 to 2026.
- ENVEO monthy: Monthly averages, Antarctic-wide. 2014 to 2021.
- ENVEO (Pine Island): 6- and 12-day snapshots, Pine Island Glacier only. 2014 to 2019.
- ENVEO ERS: Variable temporal resolution and various glaciers. 1992 to 1999.
- ENVEO TSX: Variable temporal resolution, mostly Larsen-B area. 2007 to 2018.
- ENVEO ALOS: Variable temporal resolution, mostly Larsen-B area, 2009 to 2017.
- ENVEO TSX & Sentinel-1: Variable temporal resolution, Larsen-B area. 2015 to 2016.
- ENVEO TSX & PALSAR: Variable temporal resolution, Larsen-B area. 2010 to 2012.
- MEaSUREs multi-year: Multi-year averages, Antarctic-wide. 1995-2001, 2007-2009, 2014-2017, 2020-2022.
- MEaSUREs annual: Annual (July through June) averages, Antarctic-wide. 2000 to 2025.
- MEaSUREs (ASE): Annual (calendar year) averages of the Amundsen Sea Embayment area. 1996 to 2012.
- ITS_LIVE annual: Annual (calendar year) averages, Antarctic-wide. 1985 to 2024.
- ESA CCI annual: Annual (April through March) averages, Antarctic-wide. 2021 to 2023.
- SID annual: Annual (calendar year) averages, Antarctic-wide. 2015 to 2024.
- Joughin Sentinel-1 (Pine Island): Quarterly averages over Pine Island Glacier, 2015 to 2020.
- Joughin TSX (Pine Island): Variable temporal resolution (typically a few months) over Pine Island Glacier. 2009 to 2015.
- Li (Totten): Annual to multi-year averages over Totten Glacier. 1963-1973, 1973-1989 and 1989.
A summary of these data sources is shown in Figure 3.1 and each of the data sources are detailed in the sections below.
3.2. SHIFT
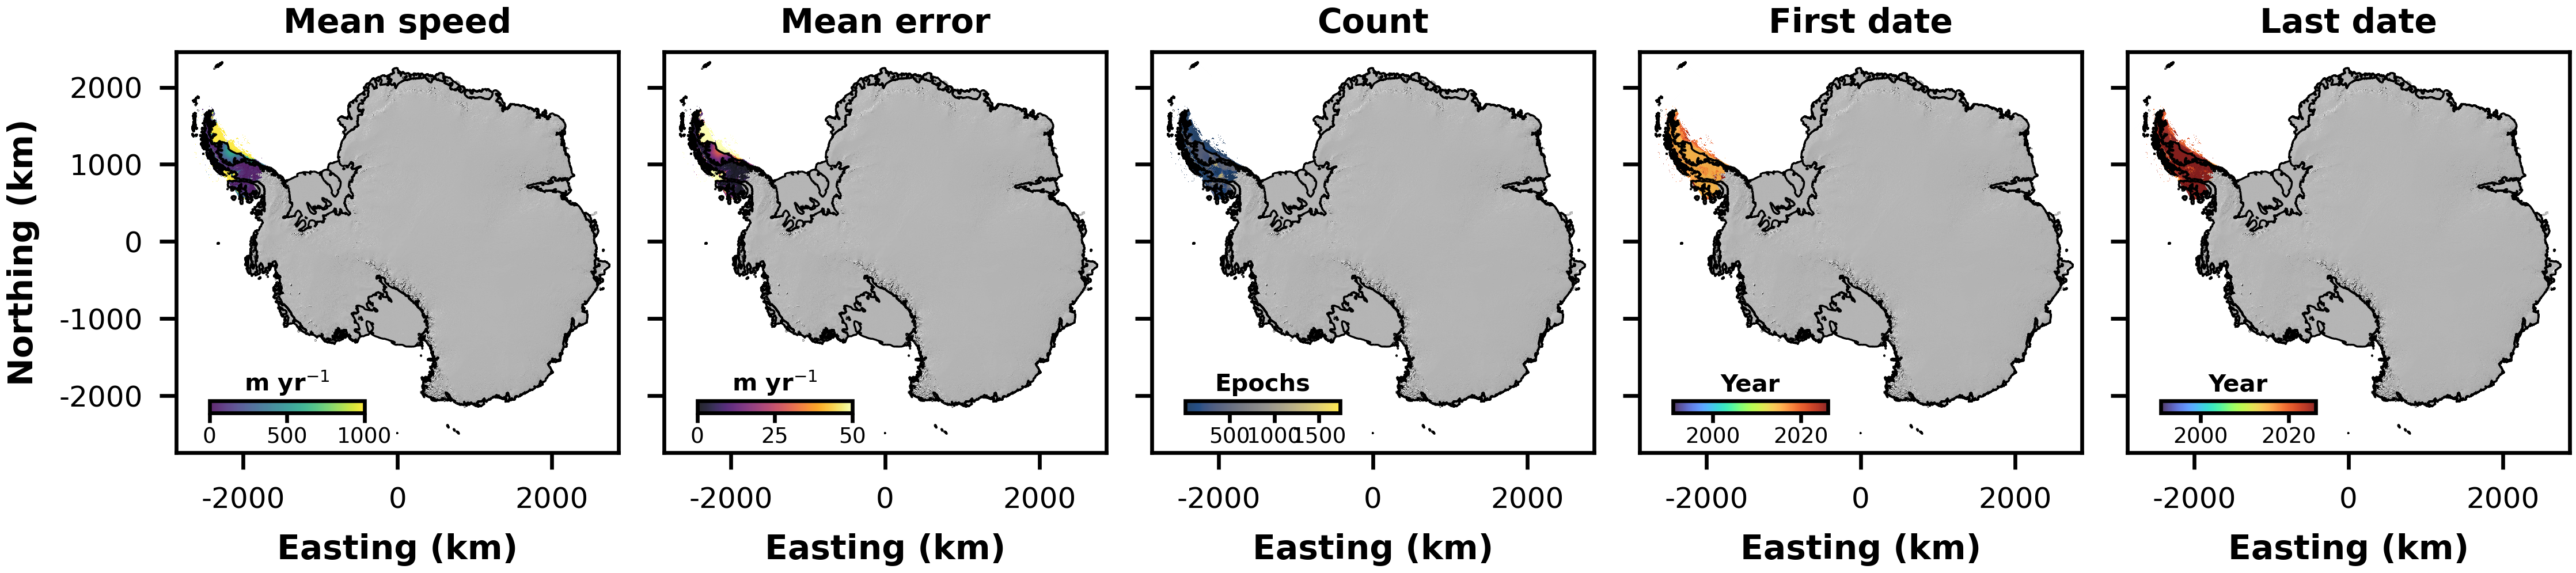
The SHIFT data provide 6- and 12-day snapshots of ice speed over the Antarctic Peninsula derived from feature intensity of Sentinel-1 image pairs from 2014 to 2026. The SHIFT processing pipeline is described in detail in the SHIFT Documentation Page.
Davison, B. J. and Sole, A. J. 2026. SHeffield Ice Flow Tracker (SHIFT) velocity data: Antarctic Peninsula ice surface velocity fields derived from intensity tracking of Sentinel-1 Synthetic Aperture Radar image pairs. [Online]. Available from: https://doi.org/10.15131/shef.data.33113111.v1
Davison, B.J., Sole, A.J., Cowton, T.R., Lea, J.M., Slater, D.A., Fahrner, D. and Nienow, P.W., 2020. Subglacial drainage evolution modulates seasonal ice flow variability of three tidewater glaciers in southwest Greenland. Journal of Geophysical Research: Earth Surface, 125(9), p.e2019JF005492. DOI: https://doi.org/10.1029/2019JF005492.
3.3. ENVEO monthly
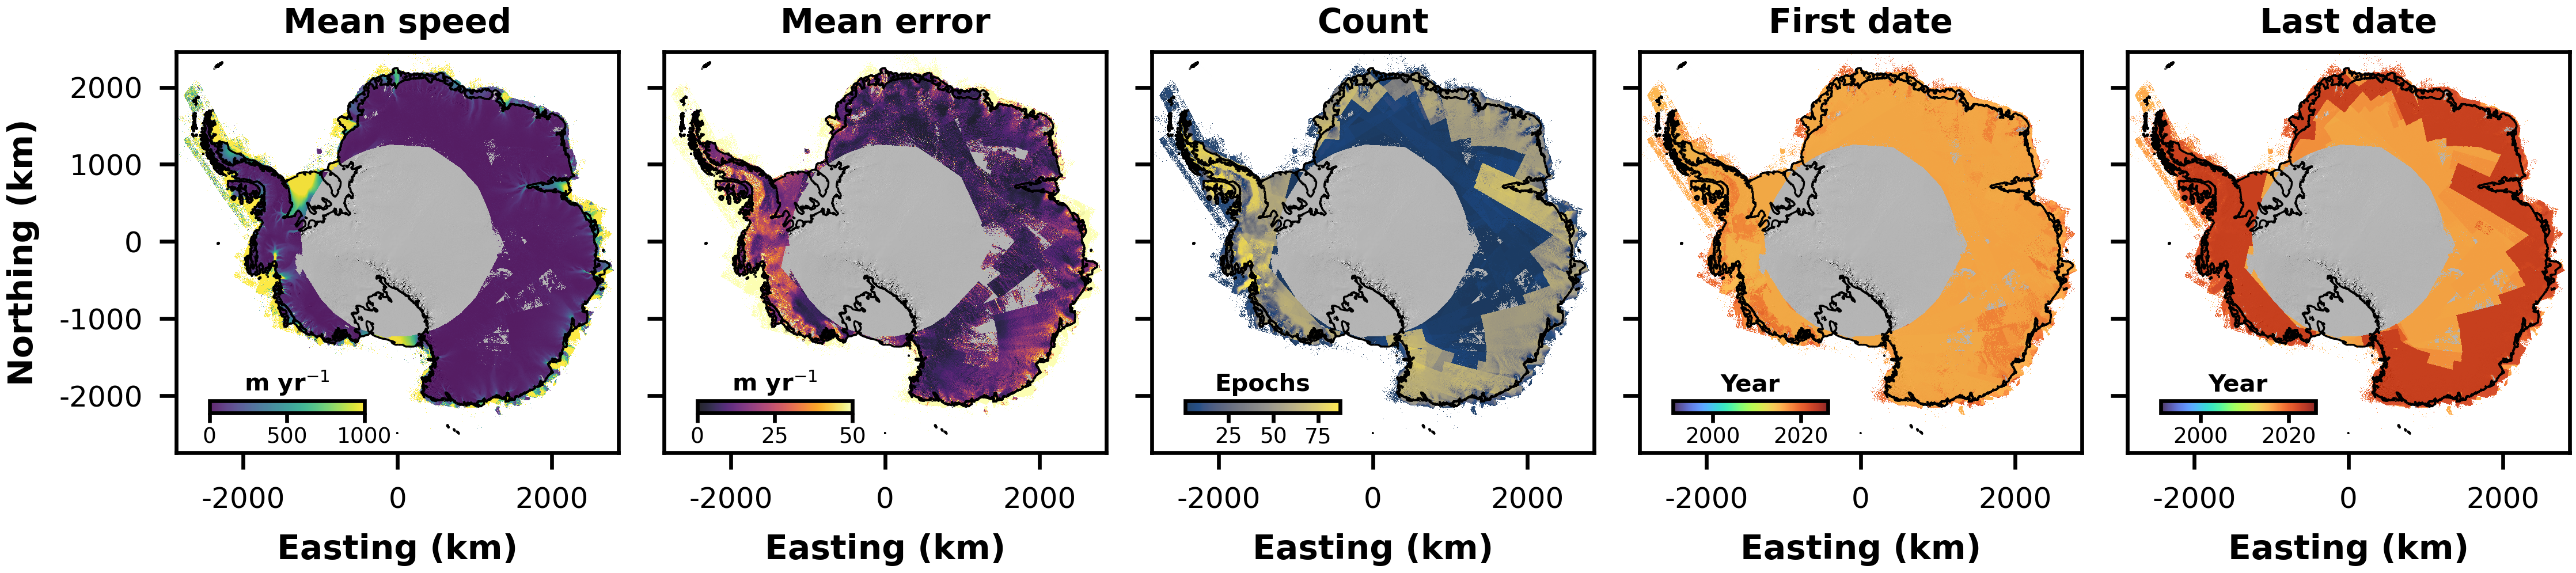
The ENVEO monthly data provide monthly averages of ice speed over the Antarctic margin derived from intensity and coherence tracking of Sentinel-1 image pairs from 2014 to 2021. The ENVEO velocity processing pipeline is described in detail in Wuite et al. (2026), and the mosaics can be downloaded from the ENVEO cryoportal.
Wuite, J., Nagler, T., Hetzenecker, M. and Rott, H., 2026. Ten years of polar ice velocity mapping using Copernicus Sentinel-1. Remote Sensing of Environment, 332, p.115092. DOI: https://doi.org/10.1016/j.rse.2025.115092
3.4. ENVEO (Pine Island)
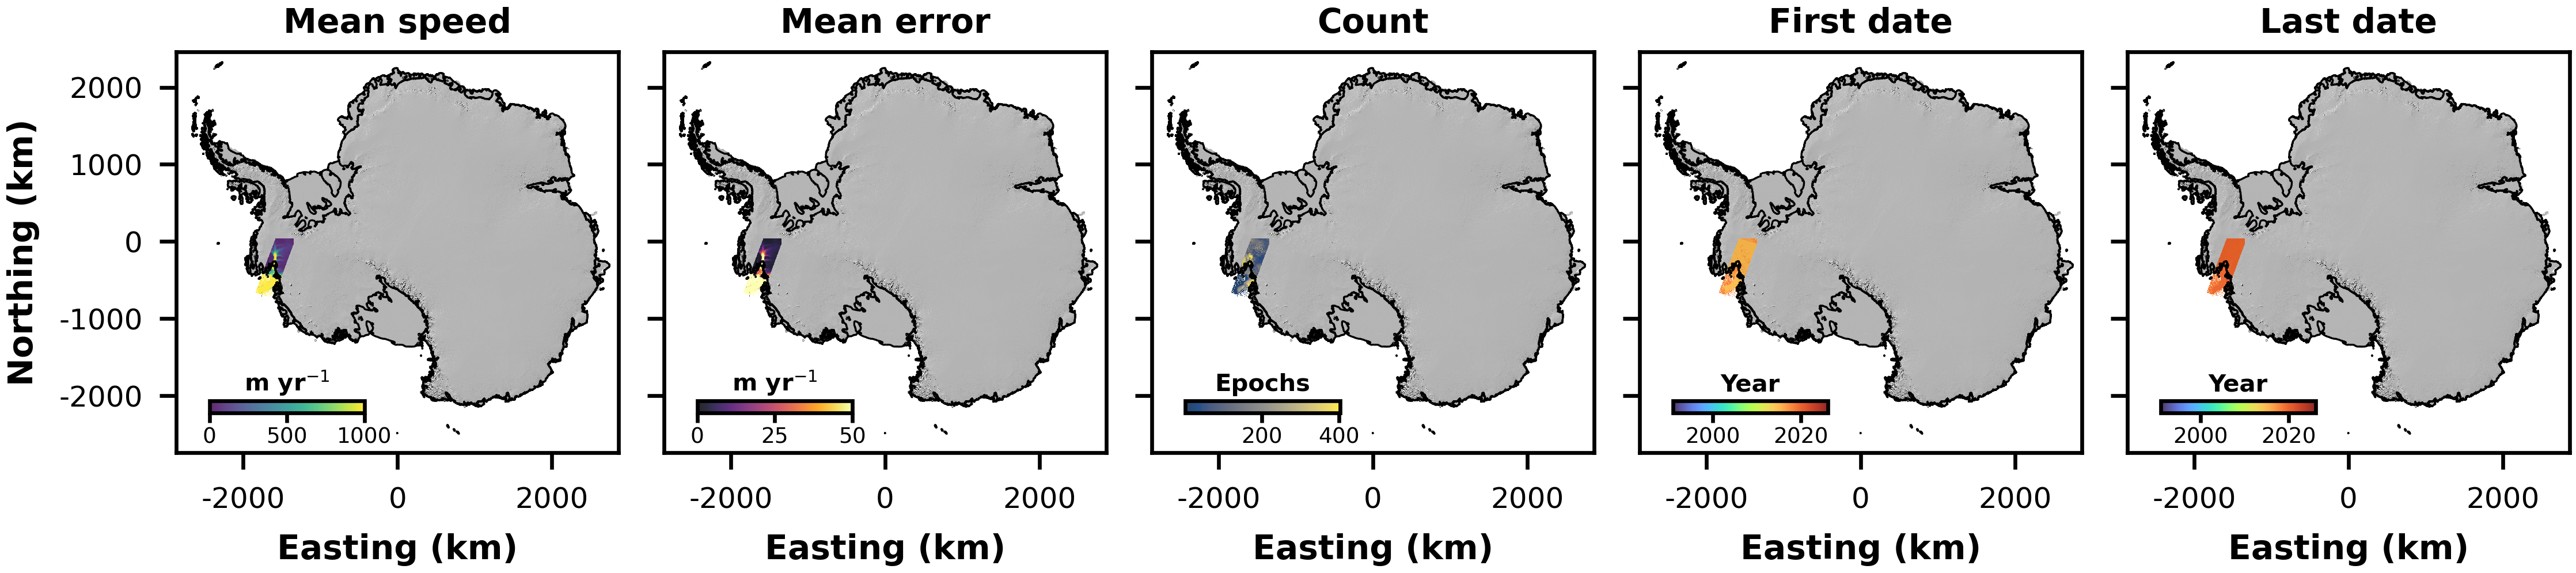
The ENVEO (Pine Island) data provide 6- and 12-day snapshots of ice speed over Pine Island Glacier derived from intensity and coherence tracking of Sentinel-1 image pairs from 2014 to 2019. The ENVEO velocity processing pipeline is described in detail in Wuite et al. (2026), and the image pair data can be downloaded from the ENVEO cryoportal.
Wuite, J., Nagler, T., Hetzenecker, M. and Rott, H., 2026. Ten years of polar ice velocity mapping using Copernicus Sentinel-1. Remote Sensing of Environment, 332, p.115092. DOI: https://doi.org/10.1016/j.rse.2025.115092
3.5. ENVEO ERS
The ENVEO ERS data provide estimates of ice speed covering the Larsen-B Embayment region, Ferrigno Ice Shelf area, Rutford Ice Stream and the Amundsen Sea Embayment region of Antarctica. The measurements are provided at a range of temporal resolutions - ranging from 8 days to 4 months during the period from 11th January 1992 to 11th November 1999. The measurements are derived from a combination of SAR interferometry and offset tracking of ERS-1 and ERS-2 imagery. The processing techniques used to derive these velocity estimates are described in Rott et al. (2011), and Wuite et al. (2015) and the data can be downloaded from the ENVEO cryoportal.
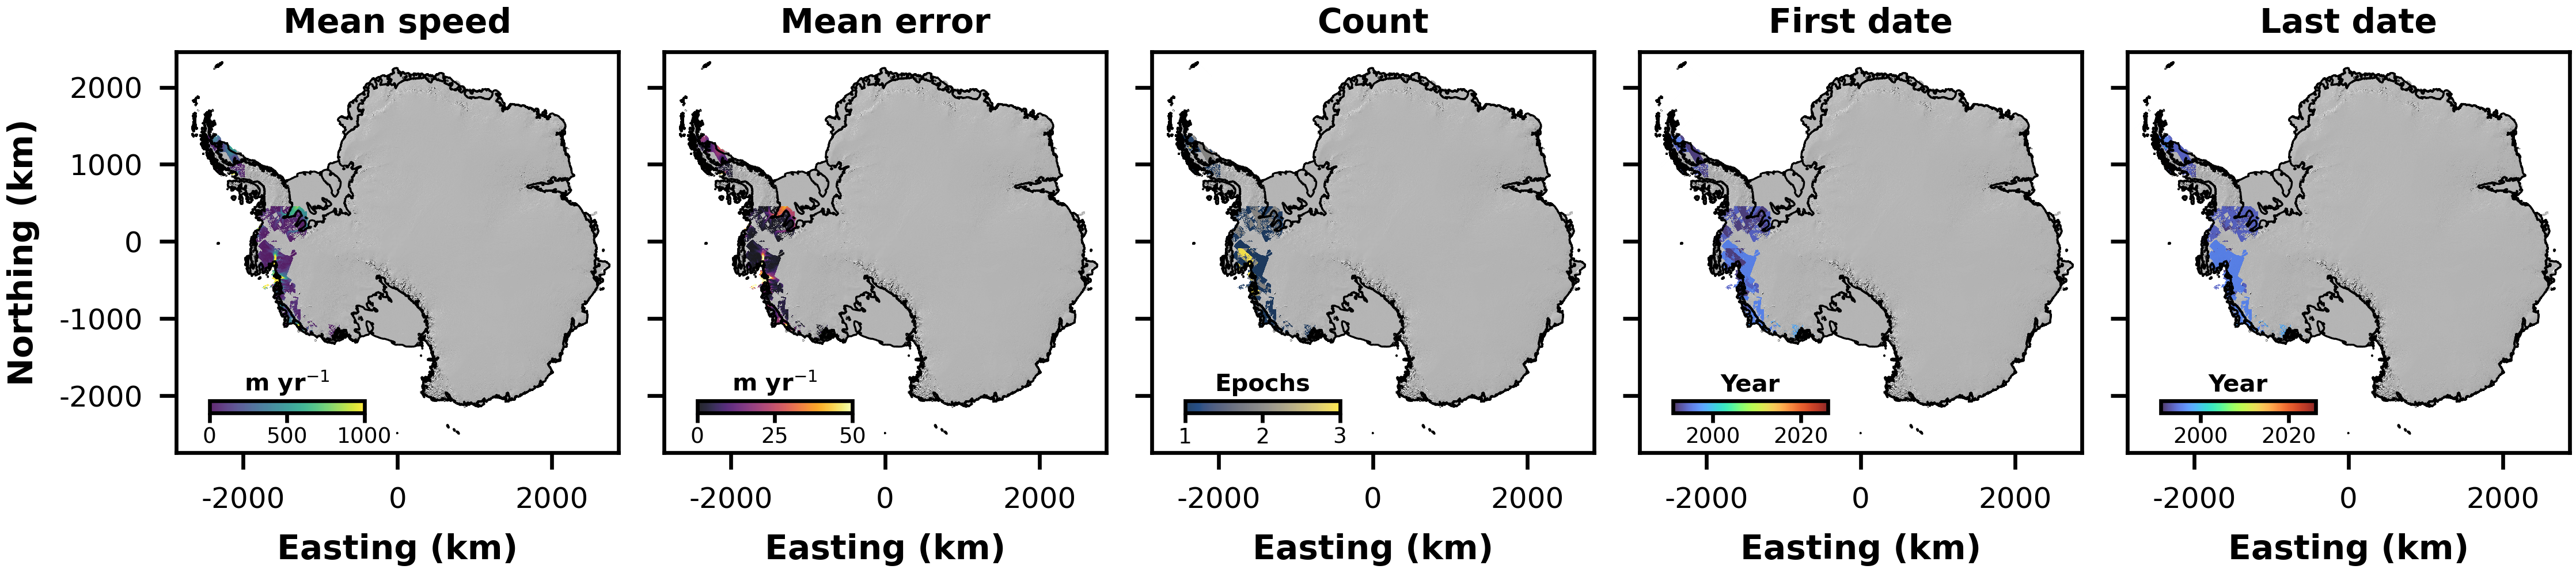
Rott, H., Müller, F., Nagler, T. and Floricioiu, D., 2011. The imbalance of glaciers after disintegration of Larsen-B ice shelf, Antarctic Peninsula. The Cryosphere, 5(1), pp.125-134. DOI: https://doi.org/10.5194/tc-5-125-2011.
Wuite, J., Rott, H., Hetzenecker, M., Floricioiu, D., De Rydt, J., Gudmundsson, G.H., Nagler, T. and Kern, M., 2015. Evolution of surface velocities and ice discharge of Larsen B outlet glaciers from 1995 to 2013. The Cryosphere, 9(3), pp.957-969. DOI: https://doi.org/10.5194/tc-9-957-2015.
3.6. ENVEO TSX
The ENVEO TSX data provide estimates of ice speed covering the Larsen-B Embayment region of the Antarctic Peninsula. The measurements are provided at a range of temporal resolutions - typically 11 or 22 days - during the period from 26th June 2007 to 12th December 2016. The measurements are derived from offset tracking of TerraSAR-X image pairs. The processing techniques used to derive these velocity estimates are described in Rott et al. (2018) and the data can be downloaded from the ENVEO cryoportal.
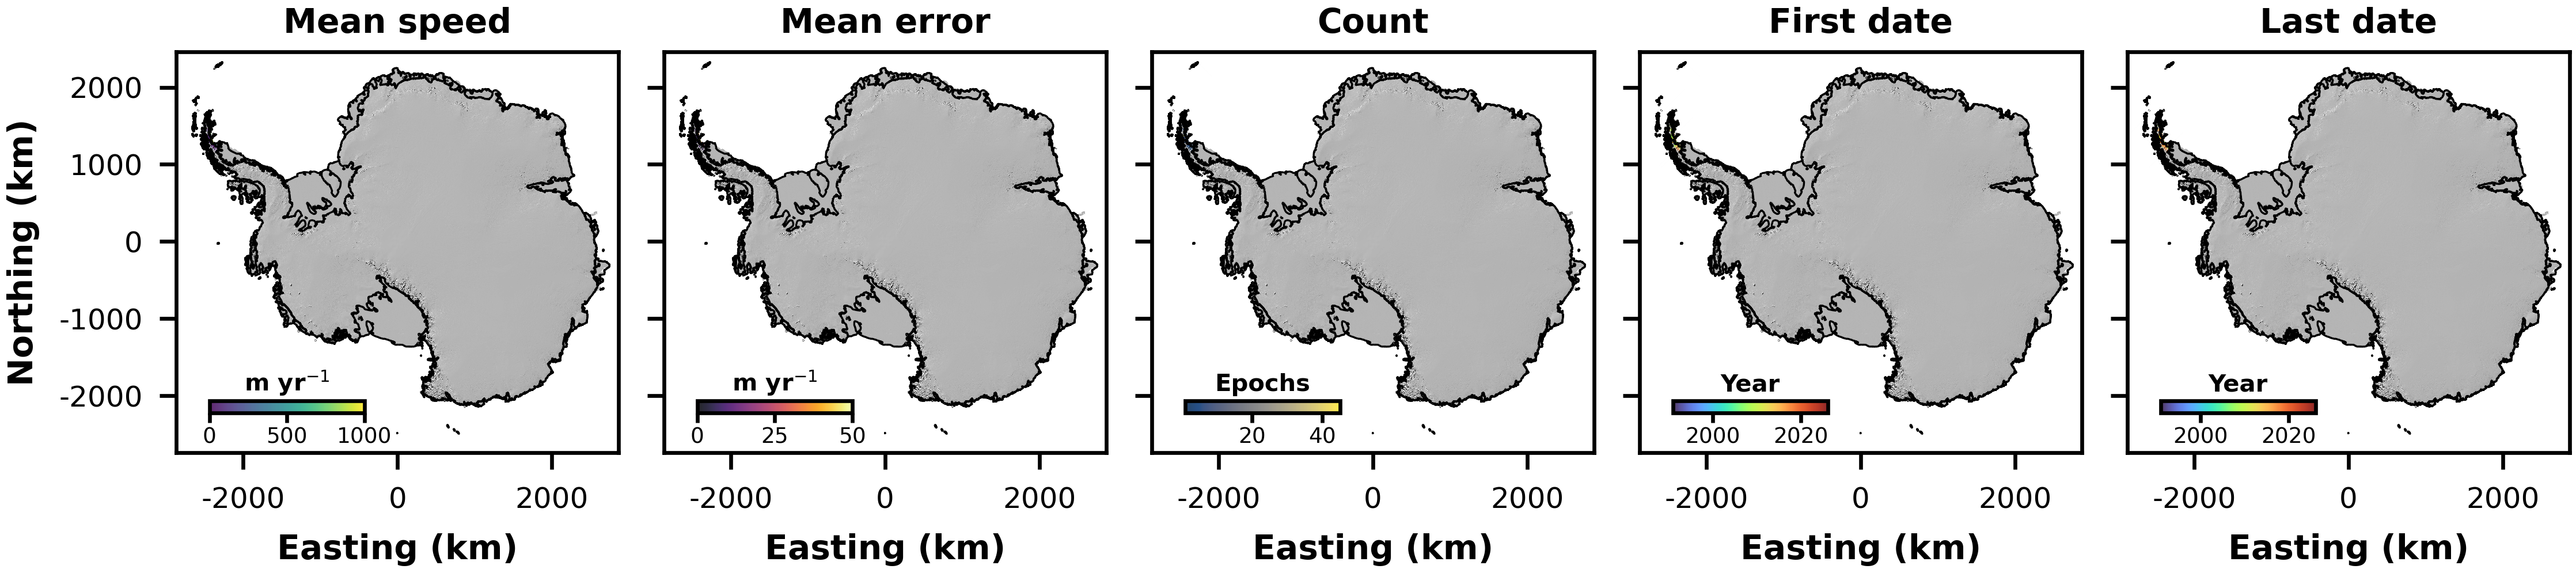
Rott, H., Abdel Jaber, W., Wuite, J., Scheiblauer, S., Floricioiu, D., Van Wessem, J.M., Nagler, T., Miranda, N. and Van Den Broeke, M.R., 2018. Changing pattern of ice flow and mass balance for glaciers discharging into the Larsen A and B embayments, Antarctic Peninsula, 2011 to 2016. The Cryosphere, 12(4), pp.1273-1291. DOI: https://doi.org/10.5194/tc-12-1273-2018.
3.7. ENVEO ALOS
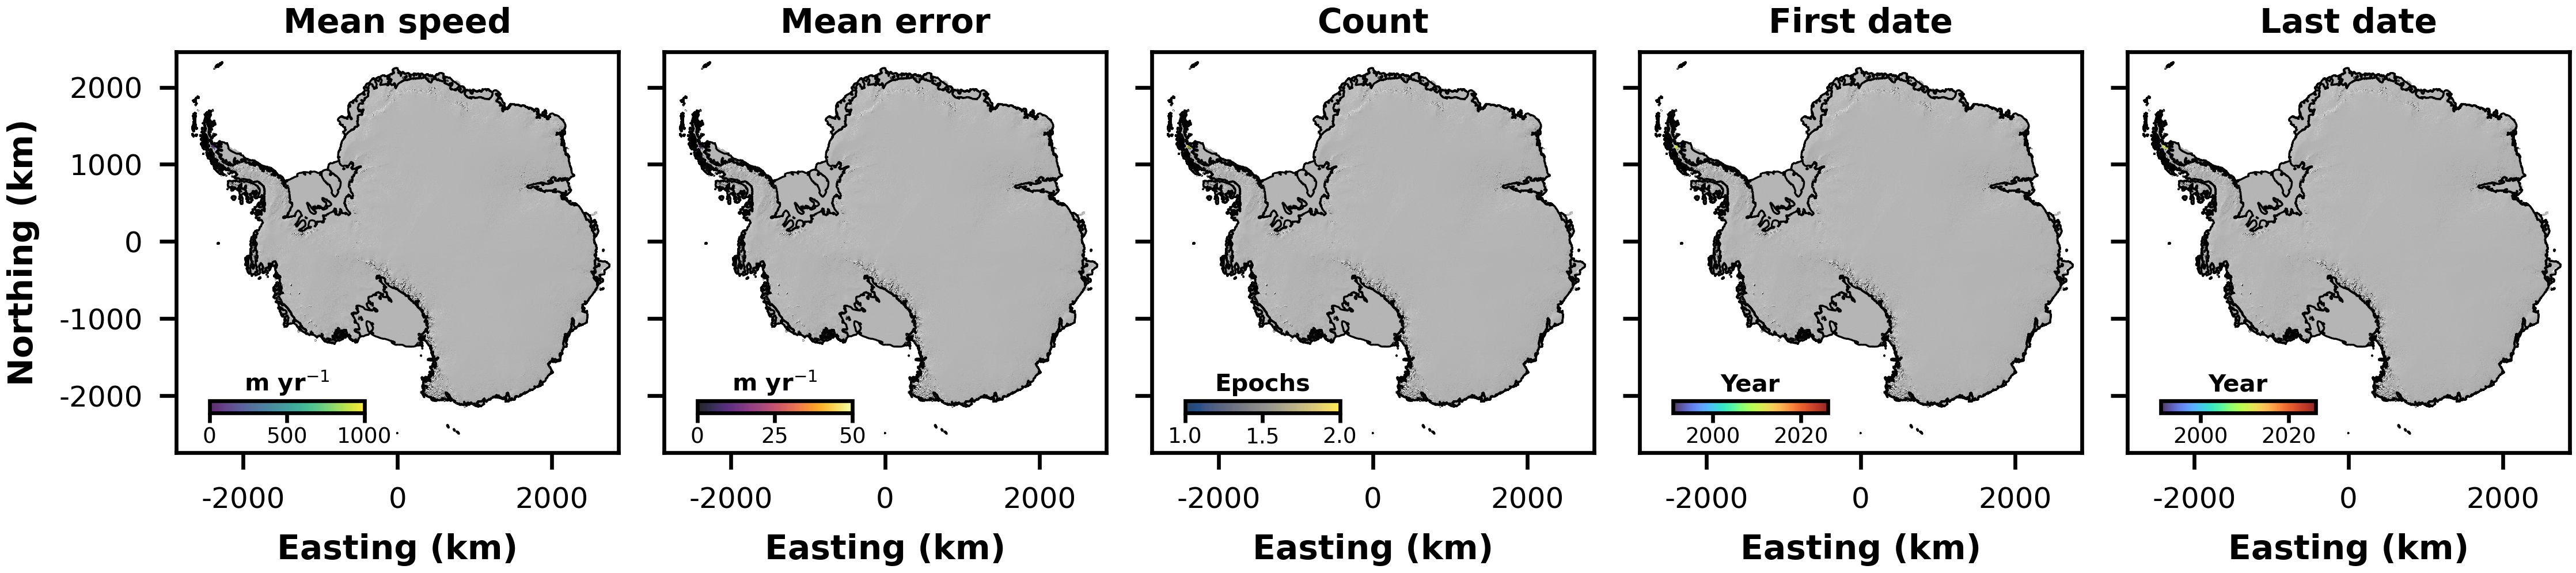
The ENVEO ALOS data provide estimates of ice speed covering the Larsen-B Embayment region of the Antarctic Peninsula from the 29th September 2009 to 13th November 2009 and the 2nd January 2011 to 17th February 2011. The measurements are derived from offset tracking of a combination of ALOS PALSAR image pairs. The data can be downloaded from the ENVEO cryoportal.
3.8. ENVEO TSX & Sentinel-1
The ENVEO TSX & Sentinel-1 data provide estimates of ice speed covering the Larsen-B Embayment region of the Antarctic Peninsula from the 31st October 2015 to the 12th December 2016. The measurements are derived from offset tracking of TerraSAR-X image pairs with gaps filled using Sentinel-1 data. The processing techniques used to derive these velocity estimates are described in Rott et al. (2018) and the data can be downloaded from the ENVEO cryoportal.
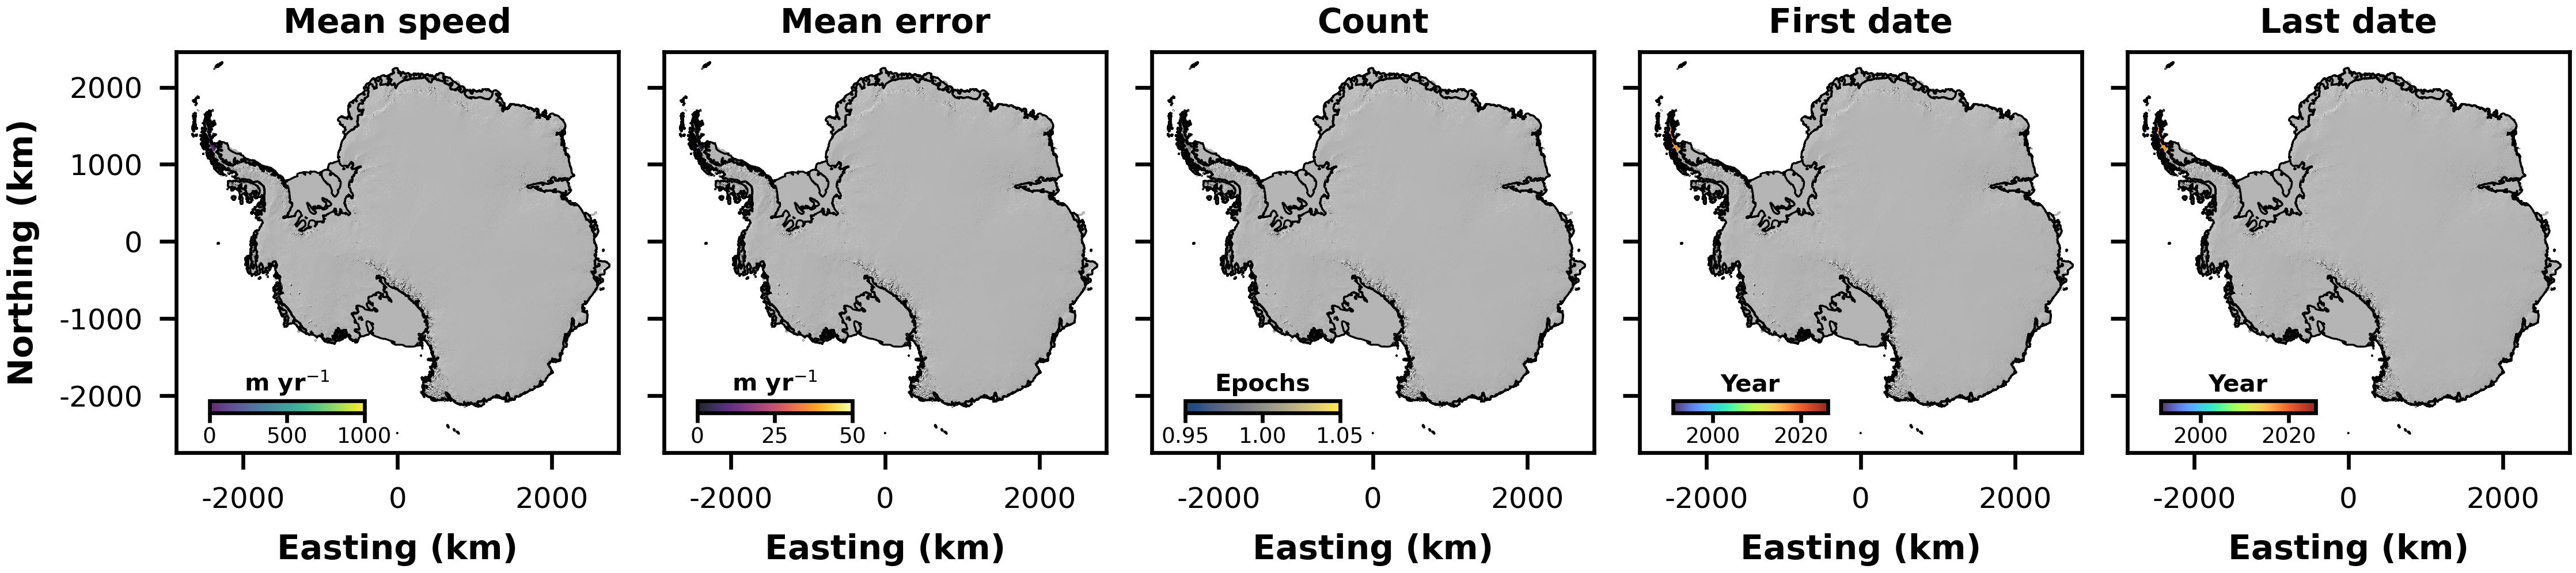
Rott, H., Abdel Jaber, W., Wuite, J., Scheiblauer, S., Floricioiu, D., Van Wessem, J.M., Nagler, T., Miranda, N. and Van Den Broeke, M.R., 2018. Changing pattern of ice flow and mass balance for glaciers discharging into the Larsen A and B embayments, Antarctic Peninsula, 2011 to 2016. The Cryosphere, 12(4), pp.1273-1291. DOI: https://doi.org/10.5194/tc-12-1273-2018.
3.9. ENVEO TSX & PALSAR
The ENVEO TSX & PALSAR data provide estimates of ice speed covering the Larsen-B Embayment region of the Antarctic Peninsula from the 2nd July 2010 to the 10th March 2012. The measurements are derived from offset tracking of TerraSAR-X image pairs with gaps filled using PALSAR data. The processing techniques used to derive these velocity estimates are described in Rott et al. (2018) and the data can be downloaded from the ENVEO cryoportal.
Rott, H., Abdel Jaber, W., Wuite, J., Scheiblauer, S., Floricioiu, D., Van Wessem, J.M., Nagler, T., Miranda, N. and Van Den Broeke, M.R., 2018. Changing pattern of ice flow and mass balance for glaciers discharging into the Larsen A and B embayments, Antarctic Peninsula, 2011 to 2016. The Cryosphere, 12(4), pp.1273-1291. DOI: https://doi.org/10.5194/tc-12-1273-2018.
3.10. MEaSUREs multi-year
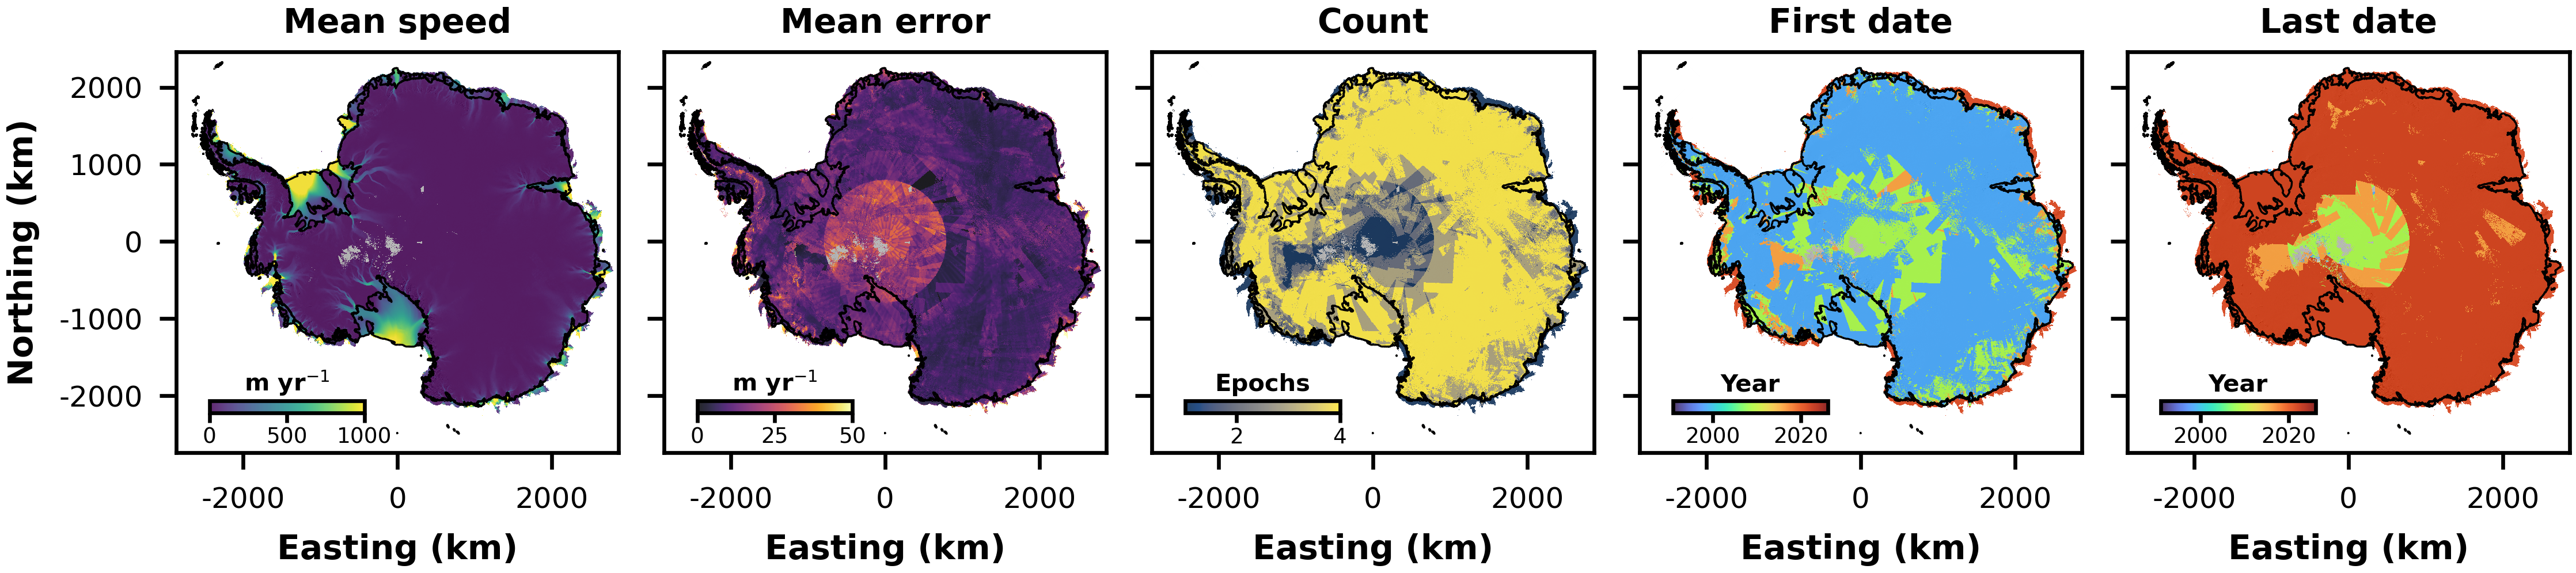
The MEaSUREs multi-year data provide estimates of ice speed for all of Antarctica from July through June of the following multi-year periods: 1995-2001, 2007-2009, 2014-2017 and 2020-2022. The measurements are derived by applying phase analysis and speckle tracking to SAR data and by feature tracking of optical imagery from Landsat 8. The processing techniques used to derive these velocity estimates are described in Rignot et al. (2022) and the data can be downloaded from NSIDC (0761).
Rignot, E., Mouginot, J., Scheuchl, B. and Jeong, S., 2022. Changes in Antarctic ice sheet motion derived from satellite radar interferometry between 1995 and 2022. Geophysical Research Letters, 49(23), p.e2022GL100141. DOI: https://doi.org/10.1029/2022GL100141.
Rignot, E., Scheuchl, B., Mouginot, J. & Jeong, S. (2022). MEaSUREs Multi-year Reference Velocity Maps of the Antarctic Ice Sheet. (NSIDC-0761, Version 1). [Data Set]. Boulder, Colorado USA. NASA National Snow and Ice Data Center Distributed Active Archive Center. https://doi.org/10.5067/FB851ZIZYX5O. Date Accessed 04-16-2026.
3.11. MEaSUREs annual
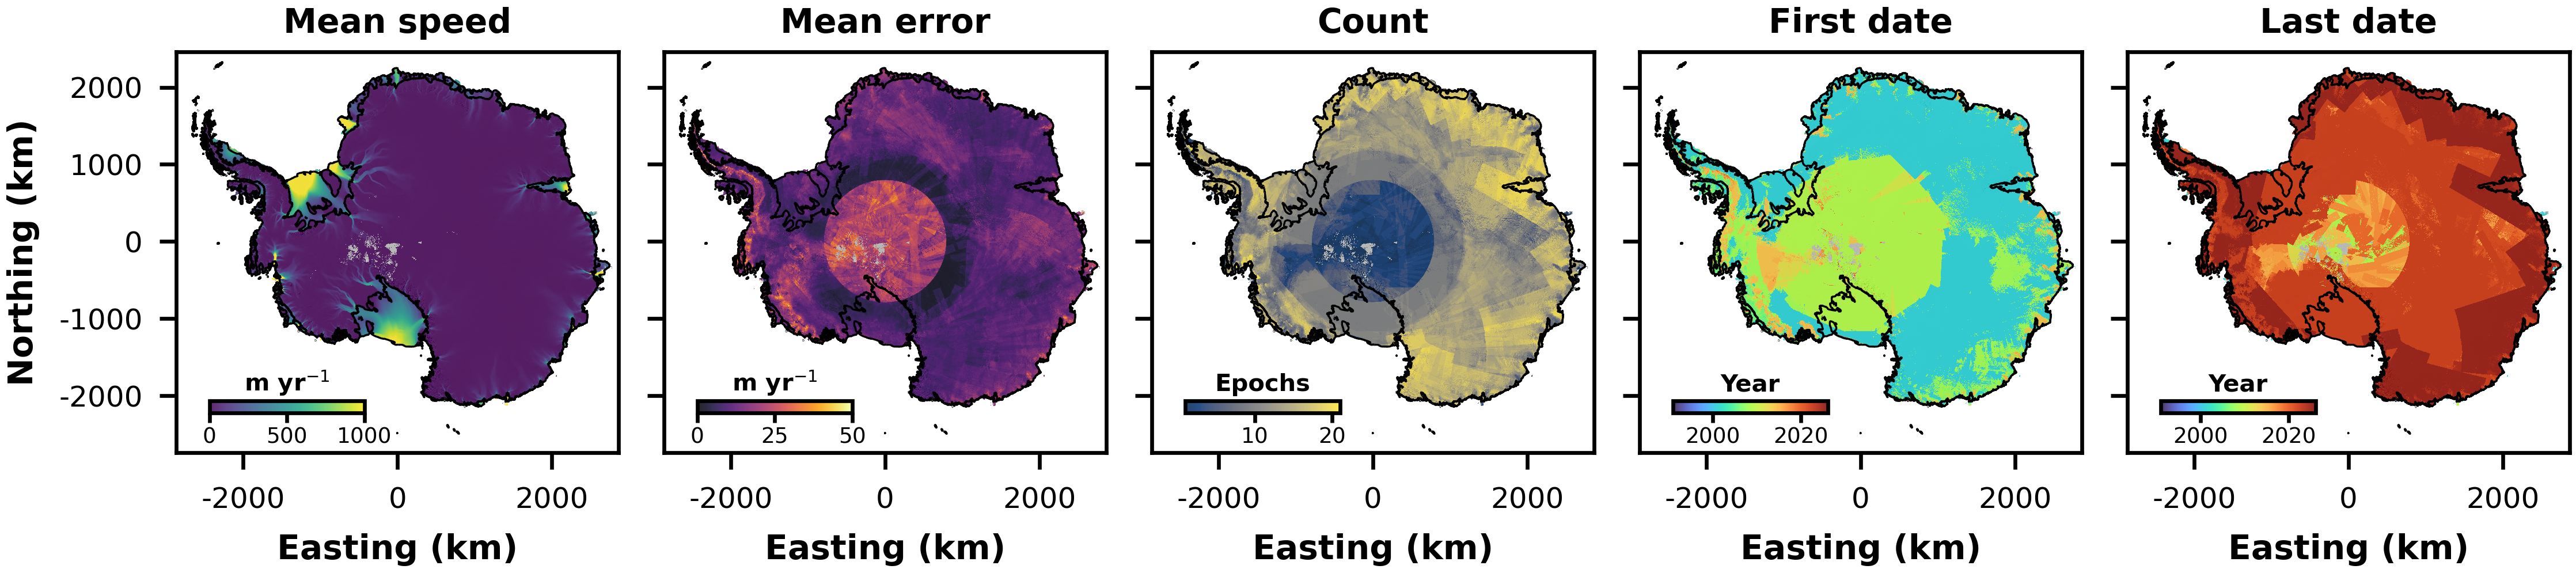
The MEaSUREs annual data provide estimates of ice speed for all of Antarctica from July through June of the following years: 2000, 2005-2025. The measurements are derived by applying phase analysis and speckle tracking to SAR data and by feature tracking of optical imagery from Landsat 8. The processing techniques used to derive these velocity estimates are described in Mouginot et al. (2017) and the data can be downloaded from NSIDC (0720).
Mouginot, J., Rignot, E., Scheuchl, B. and Millan, R., 2017. Comprehensive annual ice sheet velocity mapping using Landsat-8, Sentinel-1, and RADARSAT-2 data. Remote Sensing, 9(4), p.364. DOI: https://doi.org/10.3390/rs9040364.
Mouginot, J., Scheuchl, B. & Rignot, E. (2017). MEaSUREs Annual Antarctic Ice Velocity Maps. (NSIDC-0720, Version 1). [Data Set]. Boulder, Colorado USA. NASA National Snow and Ice Data Center Distributed Active Archive Center. https://doi.org/10.5067/9T4EPQXTJYW9. Date Accessed 04-16-2026.
3.12. MEaSUREs ASE
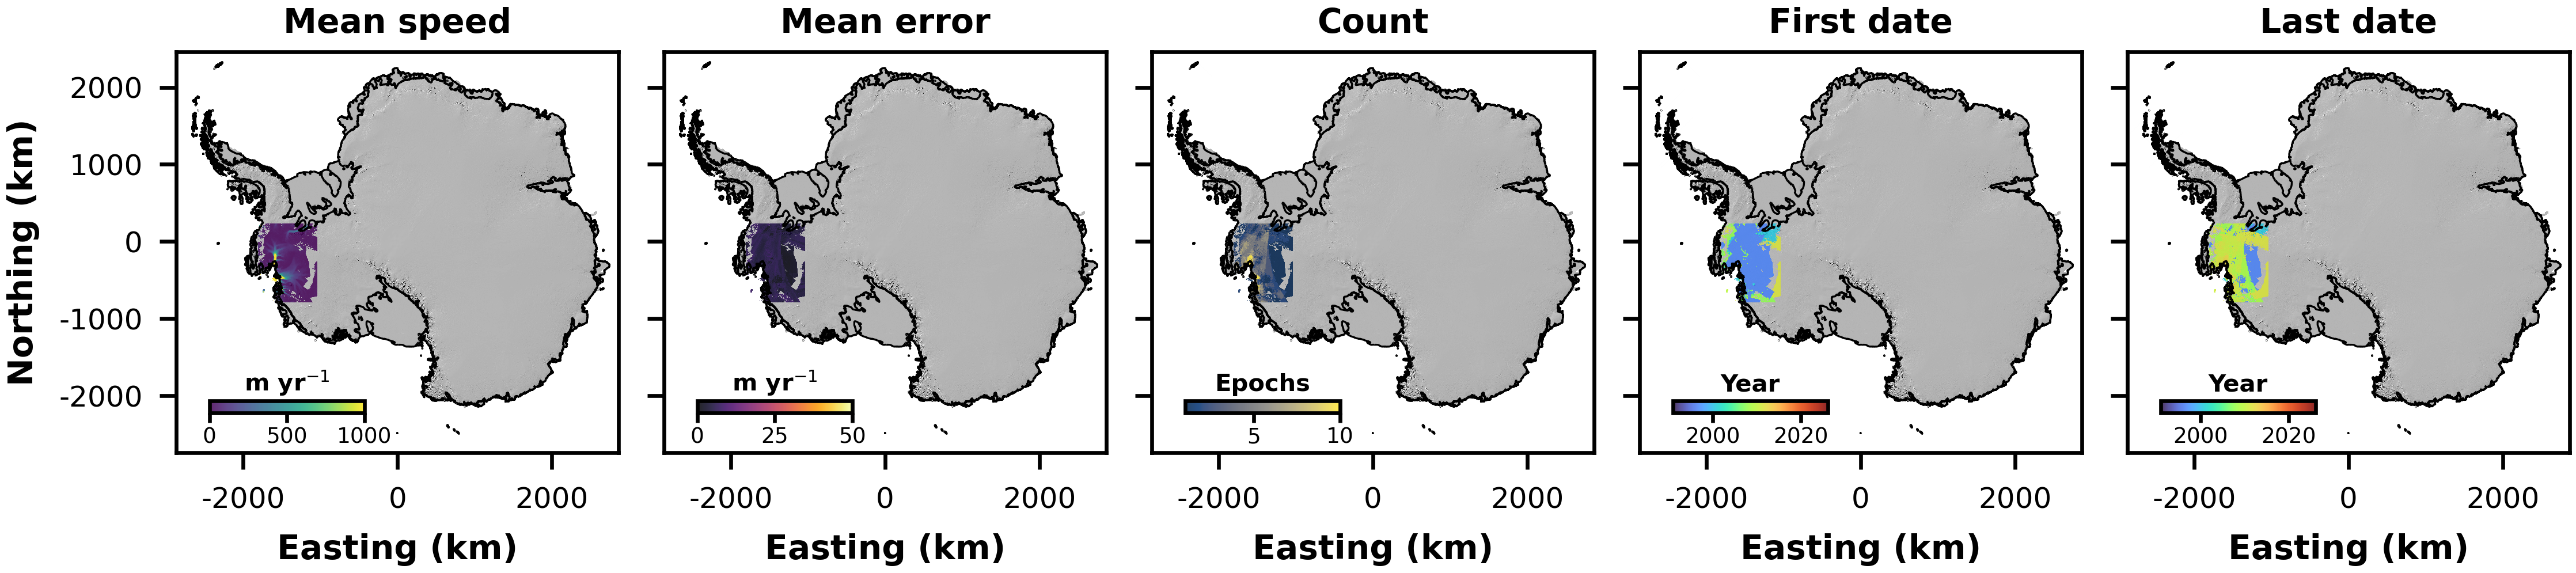
The MEaSUREs ASE data provide annual (calendar year) estimates of ice speed for the Amundsen Sea Embayment from 1996, 2000, 2002 and 2006 to 2012. The measurements are derived from SAR interferometry on a range of platforms. The processing techniques used to derive these velocity estimates are described in Mouginot et al. (2014) and the data can be downloaded from NSIDC (0545).
Mouginot, J., Rignot, E. and Scheuchl, B., 2014. Sustained increase in ice discharge from the Amundsen Sea Embayment, West Antarctica, from 1973 to 2013. Geophysical Research Letters, 41(5), pp.1576-1584. DOI: https://doi.org/10.1002/2013GL059069.
Rignot, E., Mouginot, J. & Scheuchl, B. (2014). MEaSUREs InSAR-Based Ice Velocity of the Amundsen Sea Embayment, Antarctica. (NSIDC-0545, Version 1). [Data Set]. Boulder, Colorado USA. NASA National Snow and Ice Data Center Distributed Active Archive Center. https://doi.org/10.5067/MEASURES/CRYOSPHERE/nsidc-0545.001. Date Accessed 04-16-2026.
3.13. ITS_LIVE Annual
The ITS_LIVE annual data provide annual (calendar year) averages of ice speed over Antarctica derived from feature tracking applied to a range of satellite missions from 1985 to 2024. The ITS_LIVE velocity processing pipeline is described in Gardner et al. (2025) and Lei et al. (2022) and the mosaics are available to download from the ITS_LIVE website.
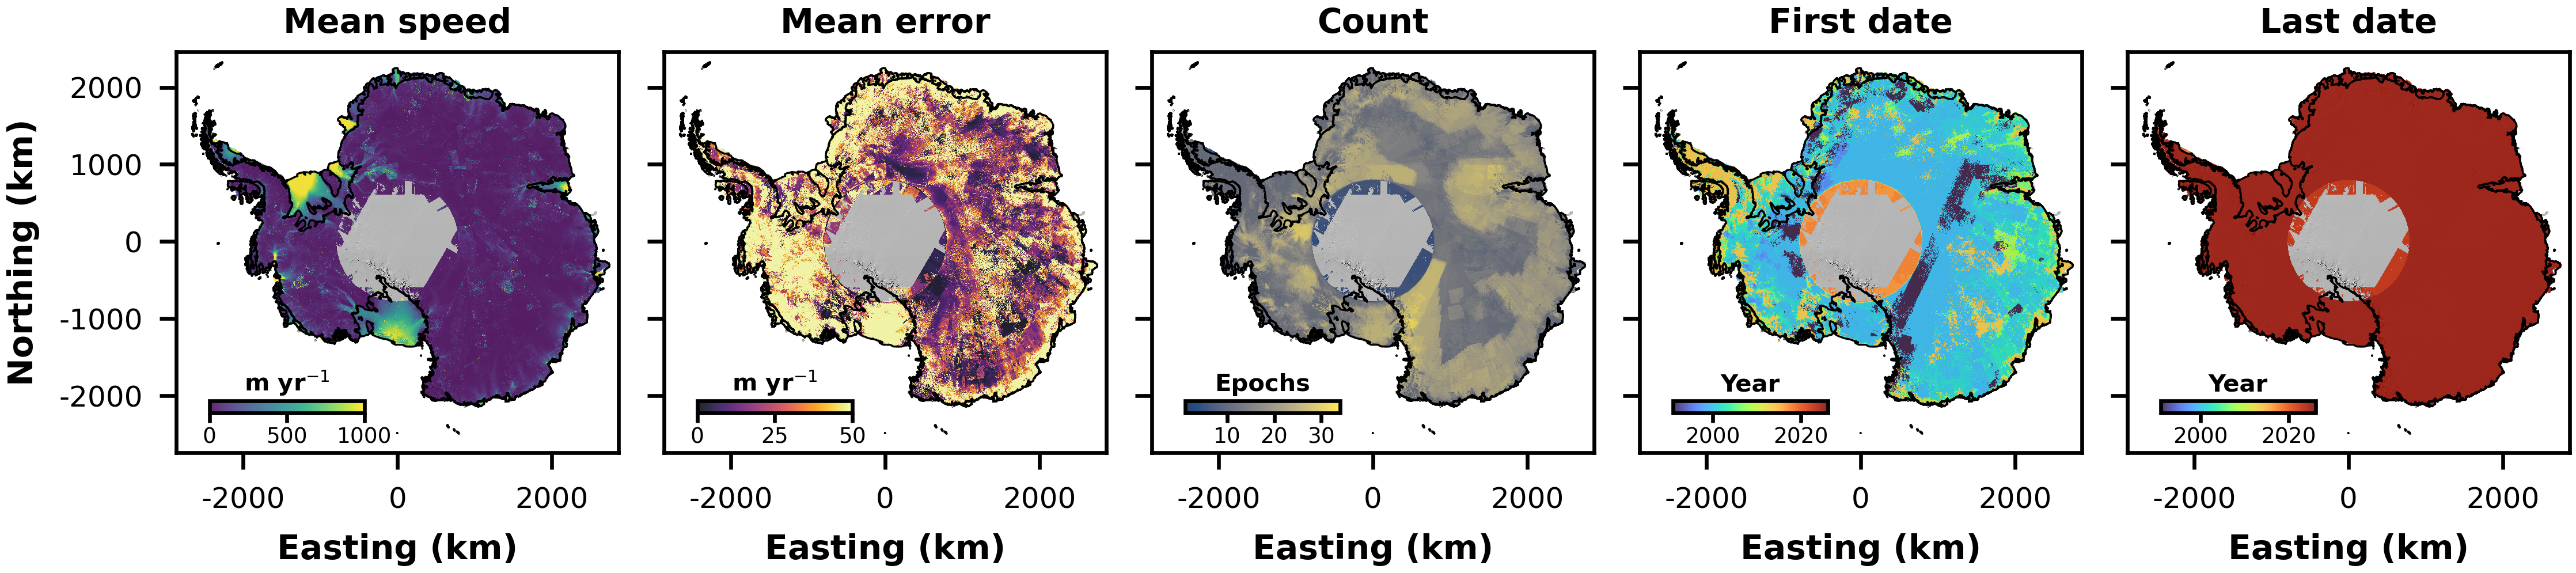
Gardner, A.S., Greene, C.A., Kennedy, J.H., Fahnestock, M.A., Liukis, M., López, L.A., Lei, Y., Scambos, T.A. and Dehecq, A., 2025. ITS_LIVE global glacier velocity data in near-real time. The Cryosphere, 19(9), pp.3517-3533. DOI: https://doi.org/10.5194/tc-19-3517-2025.
3.14. ESA CCI Annual
The ESA CCI Annual data provide annual (April through March) averages of ice speed over Antarctica derived from Sentinel-1 image pairs acquired during 2021 to 2024. The mosaics can be accessed through the Copernicus Climate Data Store.
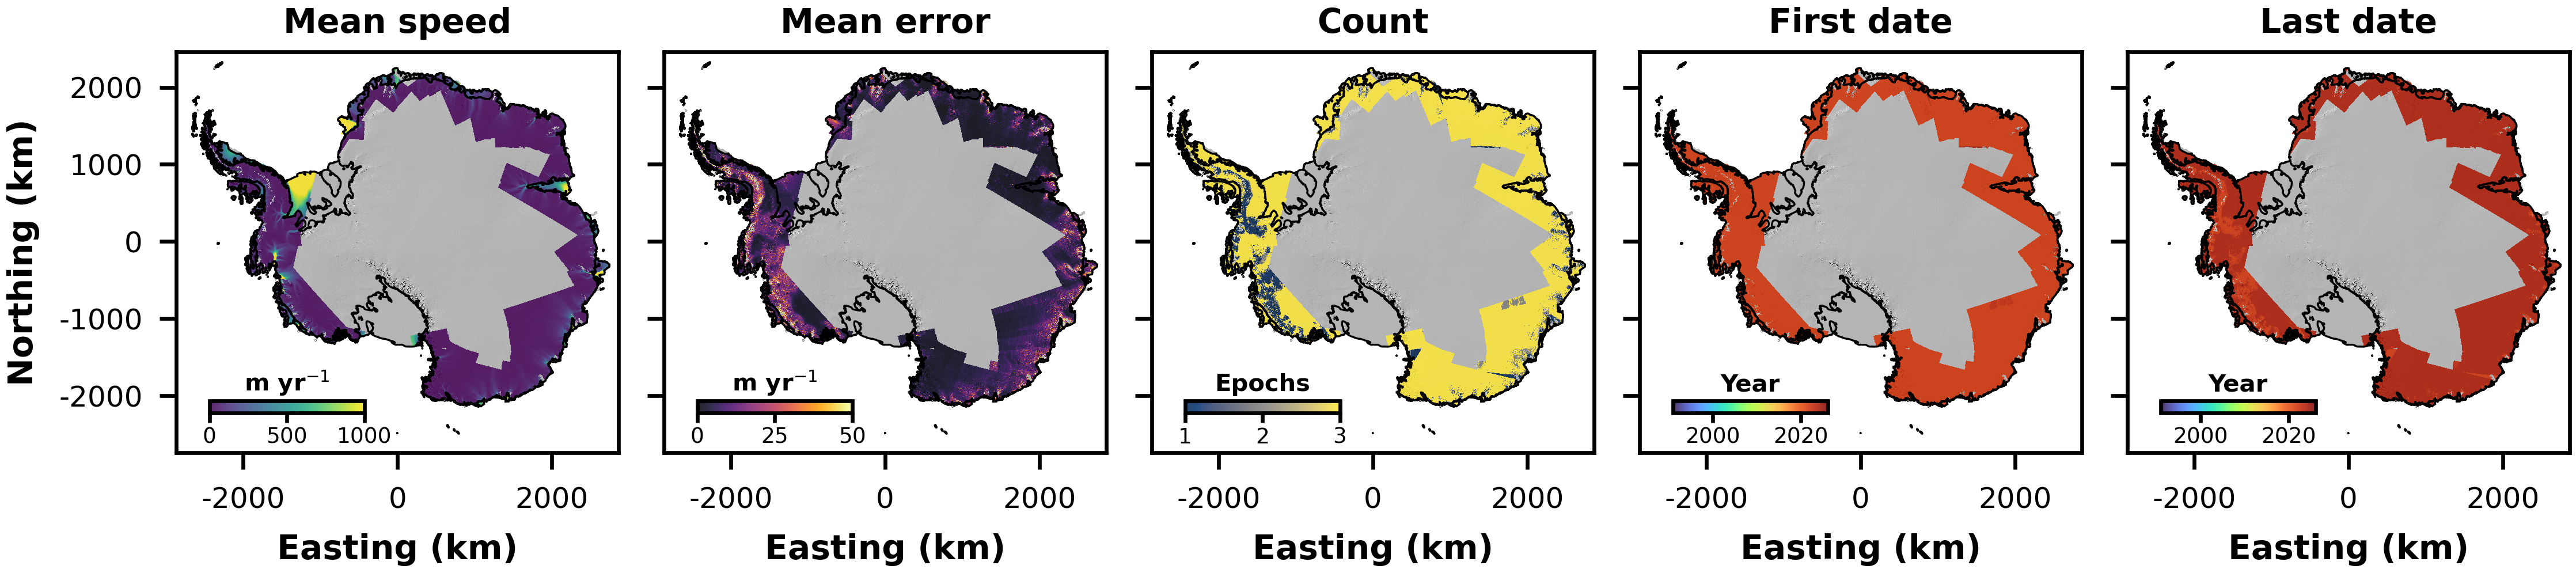
Wuite, J., (2026): Ice sheet velocity for Antarctica and Greenland derived from satellite observations. Copernicus Climate Change Service (C3S) Climate Data Store (CDS), DOI: 10.24381/cds.0b96b838 (Accessed on 26-Apr-2026)
3.15. SID Annual
The SID (Satellite Ice Dynamics) annual data provide annual (January through December) averages of ice speed over Antarctica derived from Sentinel-1 image pairs acquired during 2015 to 2025. The mosaics can be accessed through the CEDA Archive.
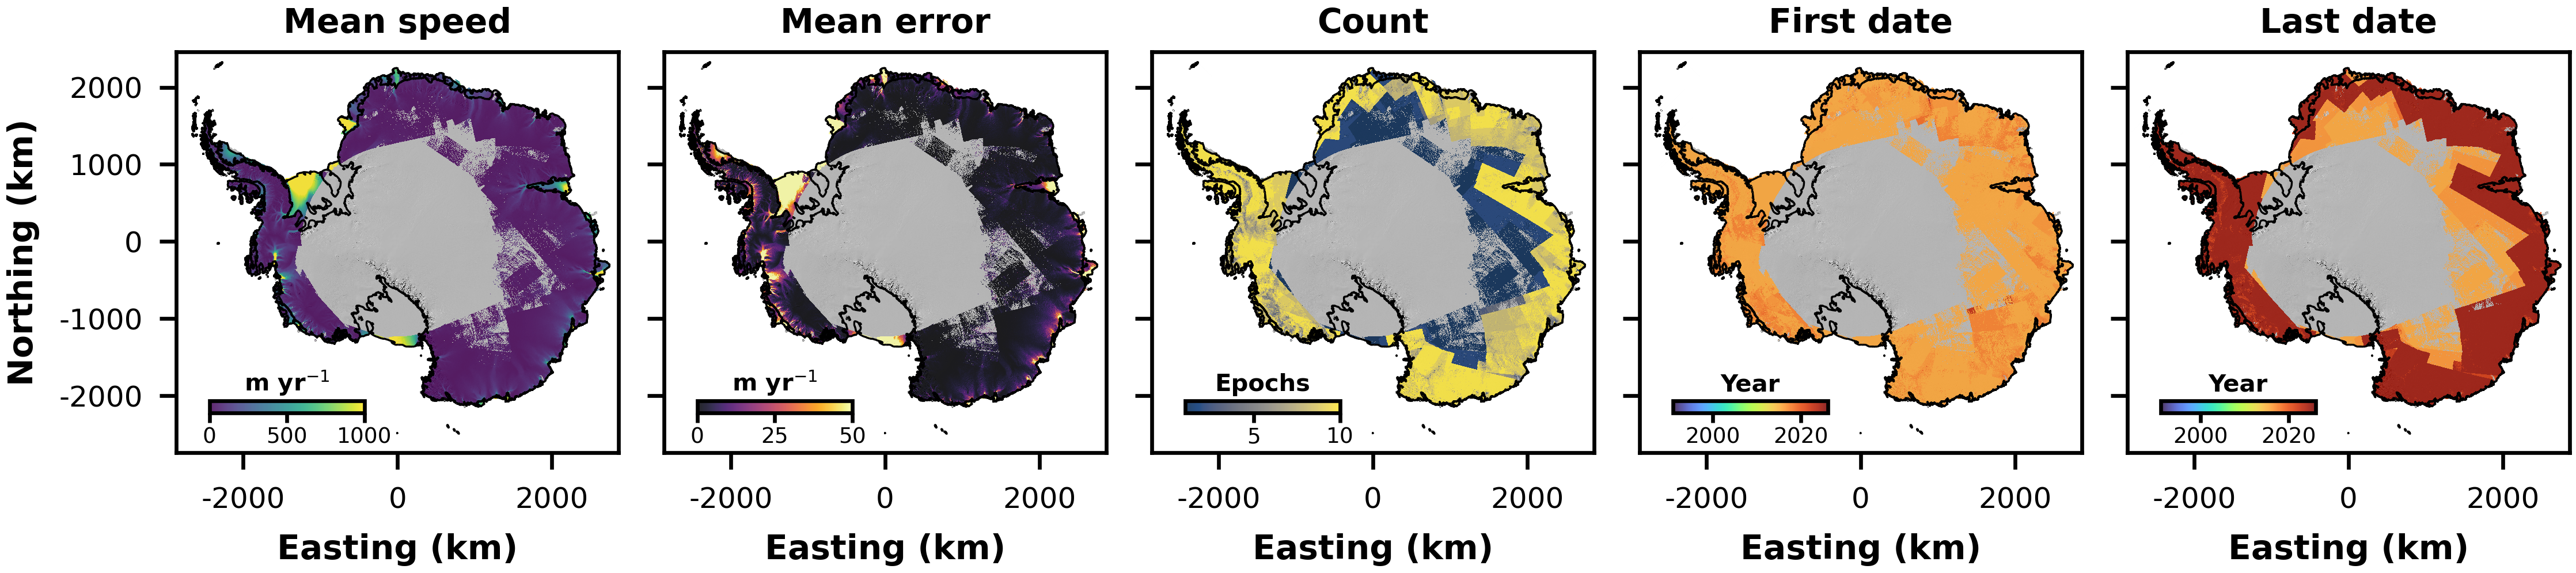
Hogg, A.E.; Davison, B.J.; Rigby, R.; Wallis, B.J.; Slater, R.A.W. (2025): EOCIS: Ice Sheet Velocity, V1. NERC EDS Centre for Environmental Data Analysis, 17 April 2025. doi:10.5285/c0b464b3da9845758cd33591e57c4abf. https://dx.doi.org/10.5285/c0b464b3da9845758cd33591e57c4abf
Davison, B.J., Hogg, A.E., Rigby, R., Veldhuijsen, S., van Wessem, J.M., van den Broeke, M.R., Holland, P.R., Selley, H.L. and Dutrieux, P., 2023. Sea level rise from West Antarctic mass loss significantly modified by large snowfall anomalies. Nature Communications, 14(1), p.1479. DOI: https://doi.org/10.1038/s41467-023-36990-3.
3.16. Joughin Sentinel-1 (Pine Island)
The Sentinel-1 quarterly averages of Pine Island Glacier ice speed are available from 1st April 2015 to the 29th September 2020. These measurements are described in Joughin et al. (2021) and the data are available from the supplementary information of that paper.
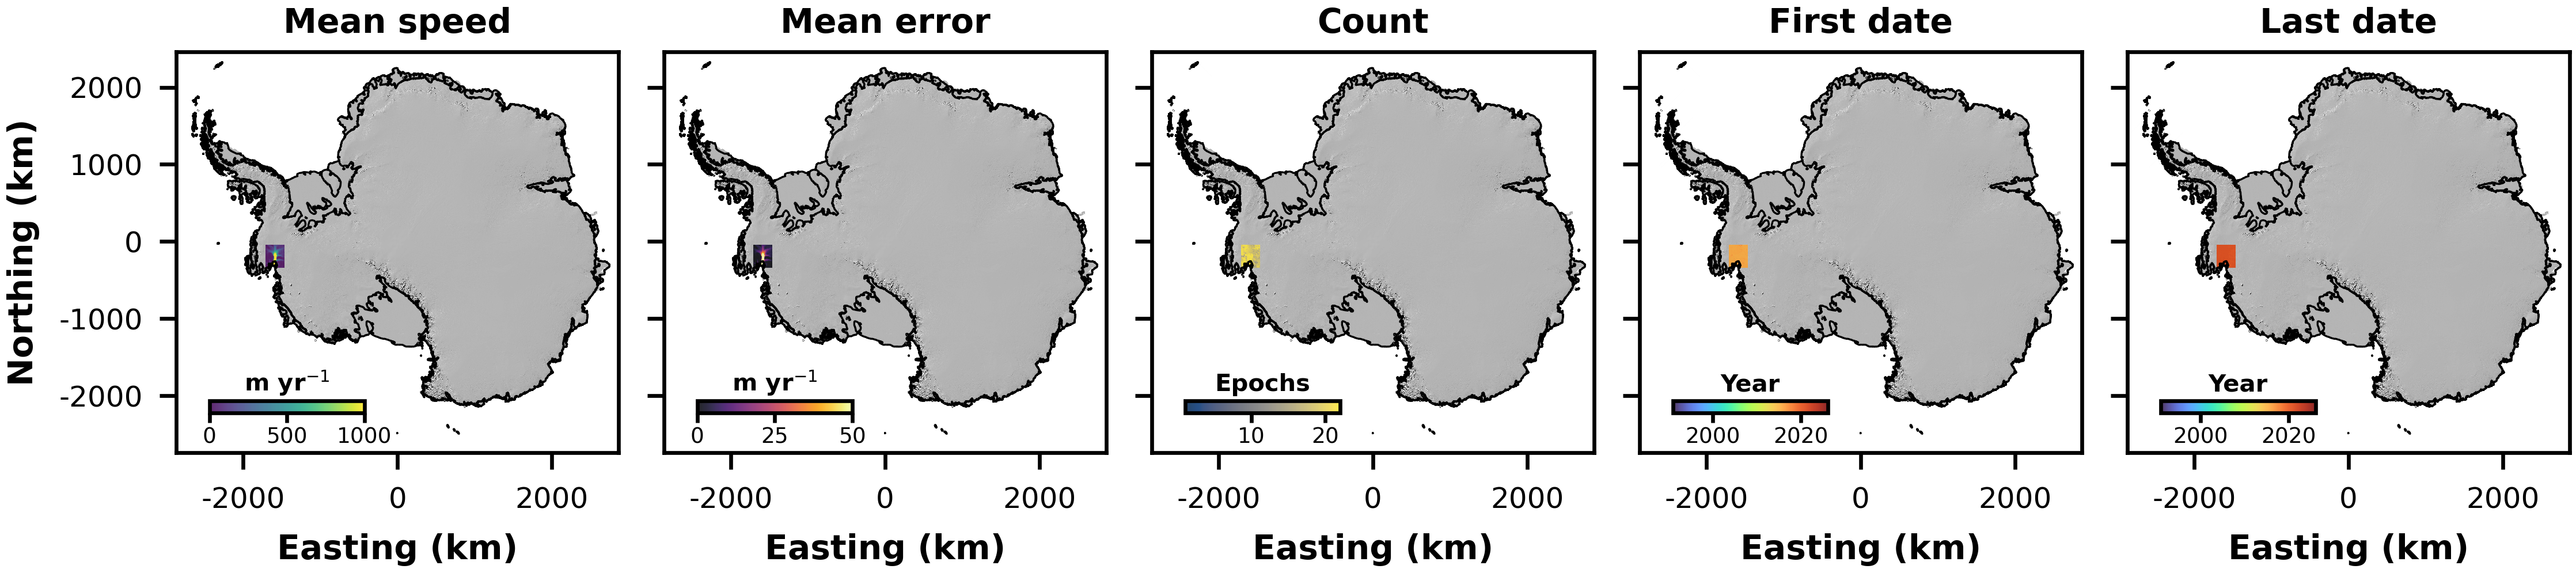
Joughin, I., Shapero, D., Smith, B., Dutrieux, P. and Barham, M., 2021. Ice-shelf retreat drives recent Pine Island Glacier speedup. Science Advances, 7(24), p.eabg3080. DOI: 10.1126/sciadv.abg3080.
3.17. Joughin TSX (Pine Island)
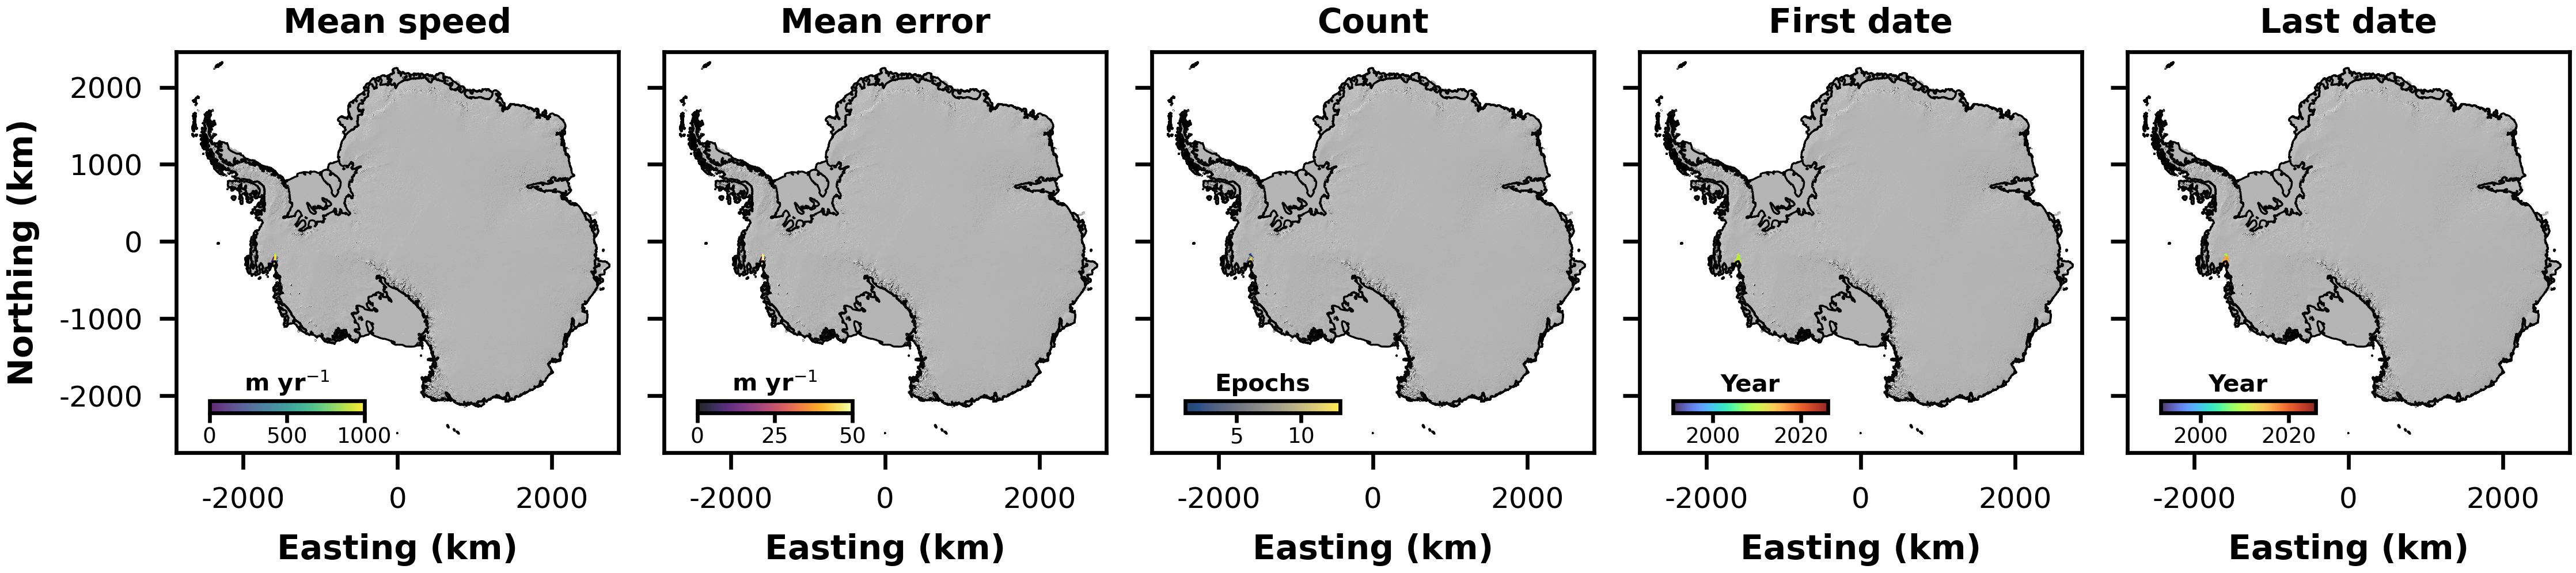
The TerraSAR-X velocity estimates of Pine Island Glacier ice speed are available from 15th January 2009 to 15th January 2016 (dates are approximate). The time period over which the measurements were made was not provided with the data but described as a "range of several months", so we have assumed a 6-month range here. These measurements are described in Joughin et al. (2021) and the data are available from the supplementary information of that paper.
Joughin, I., Shapero, D., Smith, B., Dutrieux, P. and Barham, M., 2021. Ice-shelf retreat drives recent Pine Island Glacier speedup. Science Advances, 7(24), p.eabg3080. DOI: 10.1126/sciadv.abg3080.
3.18. Li (Totten)
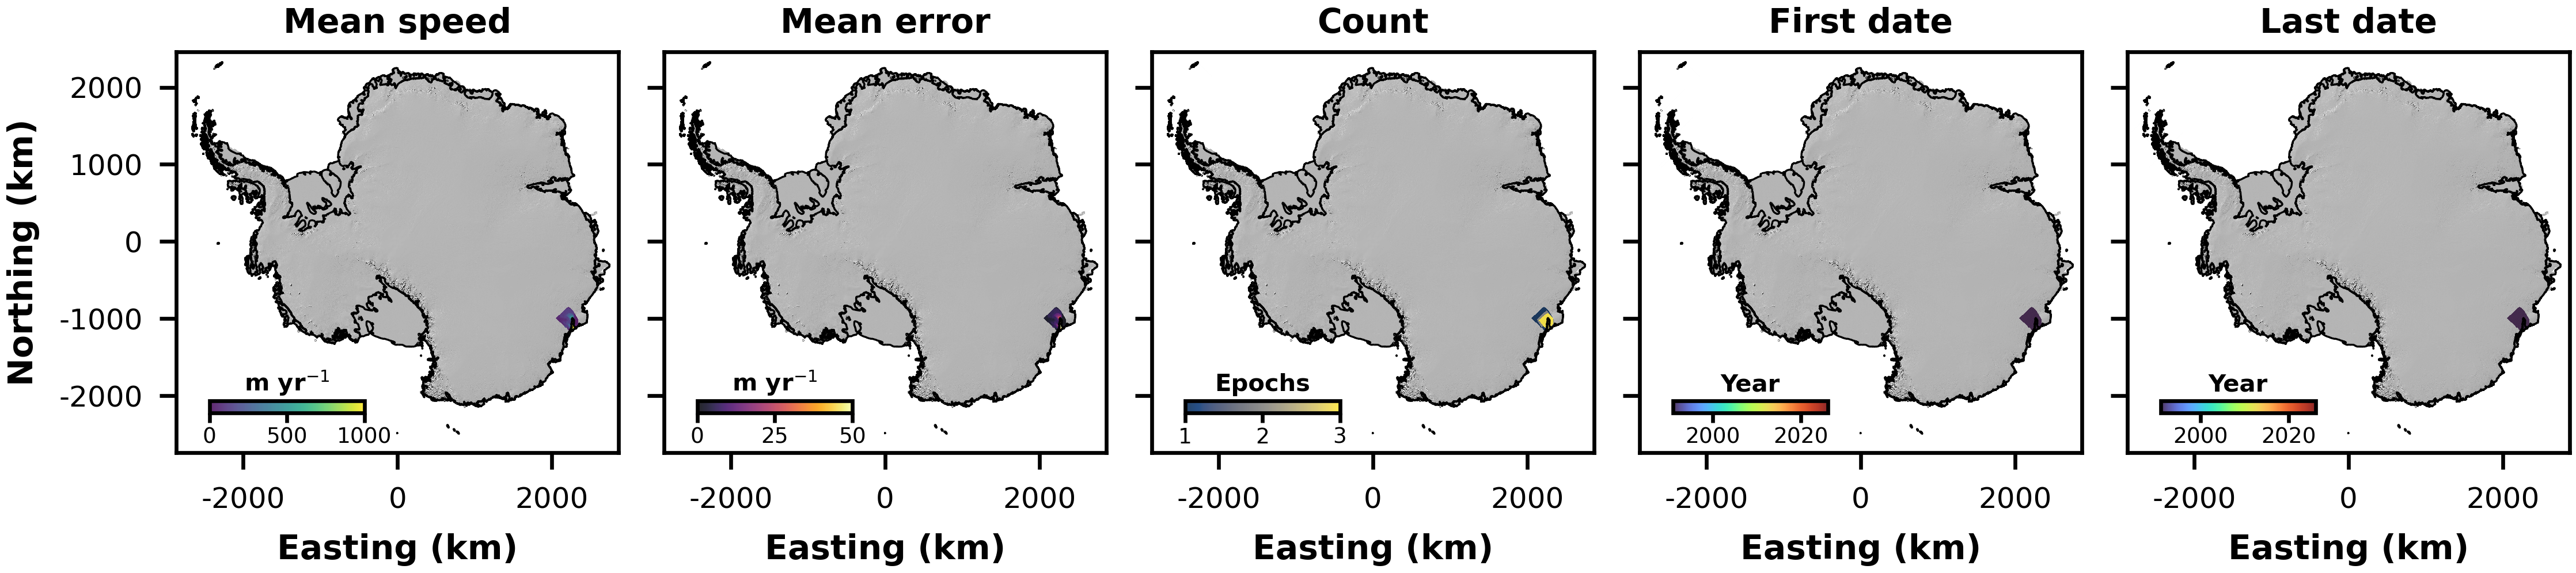
These velocity estimates only cover Totten Glacier. The measurements were derived from feature tracking of ARGON and Landsat-1&4 imagery. The measurements are available for the periods 1963-1973, 1973-1989 and 1989. Dates were not provided with the data so we have assumed calendar years. These measurements are described in Li et al. (2023). The link to the data provided in that paper did not work at the time of writing, but the authors shared the data on request.
Li, R., Cheng, Y., Chang, T., Gwyther, D.E., Forbes, M., An, L., Xia, M., Yuan, X., Qiao, G., Tong, X. and Ye, W., 2023. Satellite record reveals 1960s acceleration of Totten ice shelf in East Antarctica. Nature Communications, 14(1), p.4061. DOI: https://doi.org/10.1038/s41467-023-39588-x.